Purkinje neurons microscopic view
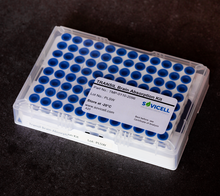
TRANSIL Brain Absorption Kit
  • Load image into Gallery viewer, Purkinje neurons microscopic view
  • Load image into Gallery viewer, TRANSIL Brain Absorption Kit
  • Load image into Gallery viewer, TRANSIL Brain Absorption Kit

TRANSIL Brain Absorption Kit

Regular price
693.00EUR
Sale price
693.00EUR
Regular price
Sold out
Unit price
per 

The TRANSIL Brain Absorption kit estimates the binding of drugs to brain tissue and predicts the disposition of drugs into brain. It measures the affinity of drugs to reconstituted porcine brain membranes. The brain membrane affinity is used to estimate the brain tissue binding and to predict the brain-to-plasma distribution via a hybrid model that also incorporates the drug’s polar surface area and its plasma protein binding. Internal quality controls provide easy assessment of recovery, experiment and data quality.

The kit consists of ready-to-use 96 well microtiter plates. One plate can be used for measuring HSA binding of up to 12 compounds. The assay requires only 5 steps: (i) addition of drug candidate, (ii) mixing and incubation for 12 minutes, (iii) removal of beads by centrifugation, (iv) sampling of supernatant, and (v) quantification of drug candidate.

Figure 1: Comparison of brain tissue binding measurements obtained with the TRANSIL Brain Absorption assay kit and dialysis.

Brain tissue binding plays an essential role in the effectiveness and safety of drugs intended to treat central nervous system (CNS) diseases. This process determines the extent of partitioning into brain tissue, which affects the drug's CNS penetration, efficacy, and toxicological effects.

Key facts about brain penetration:

  • Brain tissue binding is crucial in determining the effectiveness and safety of drugs intended to treat CNS diseases.
  • Brain tissue binding is primarily driven by the affinity of drugs to brain lipid membranes.
  • There are little species difference in brain lipid composition, thus it is not required to measure brain tissue binding in more than one species.
  • Assuming passive equilibrium, it is expected that brain to plasma drug exposure levels for any species will be predicted by the relative ratio of free fractions in these matrices.
  • Outcomes of the assay are:
    • Brain membrane affinity
    • Free fraction in brain: fu,brain
    • Brain-to-plasma distribution: logBB or Kp
    • Unbound brain-to-plasma distribution: Kp,uu
  • TRANSIL smart dialysis is more accurate and reproducible than equilibrium dialysis and its 96 well format is perfectly suited for high-throughput screening.

The assessment of the unbound drug fraction in the brain is a valuable tool to identify potential therapies for central nervous system (CNS) diseases. For many years, the focus has been on determining the brain/plasma ratio (Kp or logBB) as an indicator of brain penetration. However, in many cases, the total concentration of drugs in the brain (Cbrain) has little or no correlation with a mechanistic pharmacodynamic response. Nowadays, Cbrain is measured in in vivo experiments and corrected for the fraction of drug that is unbound, which is determined through in vitro experiments, to obtain an estimation of the brain unbound concentration (Cu,brain). This method has been proven to be successful across various CNS targets as it correlates better with receptor occupancy and pharmacodynamic endpoints.

Sovicell enables consistent, high-quality data with superior cost-efficiency based on internal quality control, and 96 well plate formats for high-throughput ADME screening.

  • How does the TRANSIL Brain Absorption Kit work?

    The TRANSIL Brain Absorption Kit measures the affinity of a test item to immobilized porcine brain membranes with natural membrane fluidity. This membrane affinity is a partitioning coefficient of drug between membrane and buffer. It is defined as the concentration of drug in membrane (cl) over the concentration of drug in buffer (cb):

    The membrane affinity is calculated from the assay data using the mass balance equation:

    which is rearranged such that the membrane affinity can be determined from the slope of plotting the ratio of total amount of drug (nt) over remaining concentration in supernatant (cb) against the lipid membrane volume present in each well:

  • How do the results from the TRANSIL Brain Absorption Kit compare literature data?

    The table below compares published brain tissue binding data obtained with RED dialysis with those obtained from TRANSIL experiments.

    Compound Name logMAbrain fu(brain)TRANSIL fu(brain)tissue homogenate Sourcetissue homogenate
    mean SD
    Amitryptilline 2,80 ± 0,0 1,4% 0,9% S
    Buspirone 1,40 ± 0,0 24,0% 22,0% M
    Caffeine 1,36 ± 0,1 25,9% 52,0% M
    Carbamazepine 1,50 ± 0,1 19,6% 11,9% S
    Carisoprodol 1,30 ± 0,1 29,5% 20,2% M
    Chlorpromazine 3,70 ± 0,1 0,2% 0,2% S
    Clozapine 3,20 ± 0,2 0,6% 0,9% M
    Cyclobenzaprine 2,95 ± 0,2 1,0% 0,7% M
    Diazepam 1,92 ± 0,1 8,3% 5,0% M
    Fluoxetine 3,52 ± 0,1 0,3% 0,2% M
    Fluvoxamine 3,10 ± 0,2 0,7% 0,8% M
    Haloperidol 2,74 ± 0,2 1,5% 0,7% M
    Hydroxyzine 2,60 ± 0,1 2,1% 1,0% M
    Metoclopramide 1,30 ± 0,2 29,5% 31,0% M
    Nortriptyline 3,40 ± 0,1 0,4% 0,5% M
    Paroxetine 3,62 ± 0,1 0,3% 0,4% M
    Phenytoin 2,20 ± 0,1 4,7% 8,1% M
    Risperidone 2,10 ± 0,2 5,7% 6,7% M
    Sulpiride 1,40 ± 0,1 24,0% 63,0% M
    Thioridazine 4,60 ± 0,2 0,03% 0,1% S
    Trazodone 2,10 ± 0,2 5,7% 4,7% M
    Trifluoperazine 3,80 ± 0,1 0,18% 0,1% S
    Venlafaxine 1,73 ± 0,1 12,3% 21,0% M
    a M: Maurer et al. 2005, and S: Summerfield et al. 2007
  • What are the main quality control measures applied in TRANSIL assays?

    The TRANSIL Quality Index (TQI) is based on independent measures derived from the data analysis.

    • Model fit (see equation 3 of the section “how the assay works”
    • Recovery: does the model derived compound concentration equal the true concentration?
    • Data consistency: does membrane binding increase proportionally with the increasing TRANSIL bead content in each well?
    • Data consistency: are the estimated reference concentrations in alignment with the compound concentration used?
    • Missing data and outliers.
  • How long does it take to run the assay?

    One assay plate can be used for 12 compounds. Thus, you’ll need to pipette 15 µl of test item to each of 8 wells and repeat this for all 12 compounds. This takes less than 10 minutes even with manual pipetting. After compound addition, the plate is ready for incubation. You can do this with an electronic 8 or 12 channel pipette by aspirating and dispensing a volume of 120 µl for 15 times. That takes just over a minute for each column or row. In total, that makes 8 to 15 minutes depending on your pipette. When using a pipetting robot with a 96 well head this time decreases to 2 minutes. After incubation, the plate needs to be spun in a plate centrifuge for 10 minutes. The supernatants are then ready for quantification by LC/MS/MS, UV, fluorescence or any other method of your choice.

    Thus, the total time the start and end of the experiment varies between 7 and 25 minutes depending upon your equipment.

  • How many compounds can be analyzed with one plate?

    One assay plate can be used for 12 compounds. A special feature of the 96 well plates used for these kits is that each of the 12 columns can be separated from the plate. Thus, it is possible to use the plate for one compound at a time.

  • Are TRANSIL assay kits supplied in low-binding plates?

    The TRANSIL assay kits utilize Micronic 96 well plates with ultra-low-binding tubes. Standard polypropylene tubes have 41x higher non-specific binding and low-binding tubes from other vendors have 2.6x higher non-specific binding.